Monitoring
Observability
Observability is the ability to understand the internal state of a system based on the data it produces
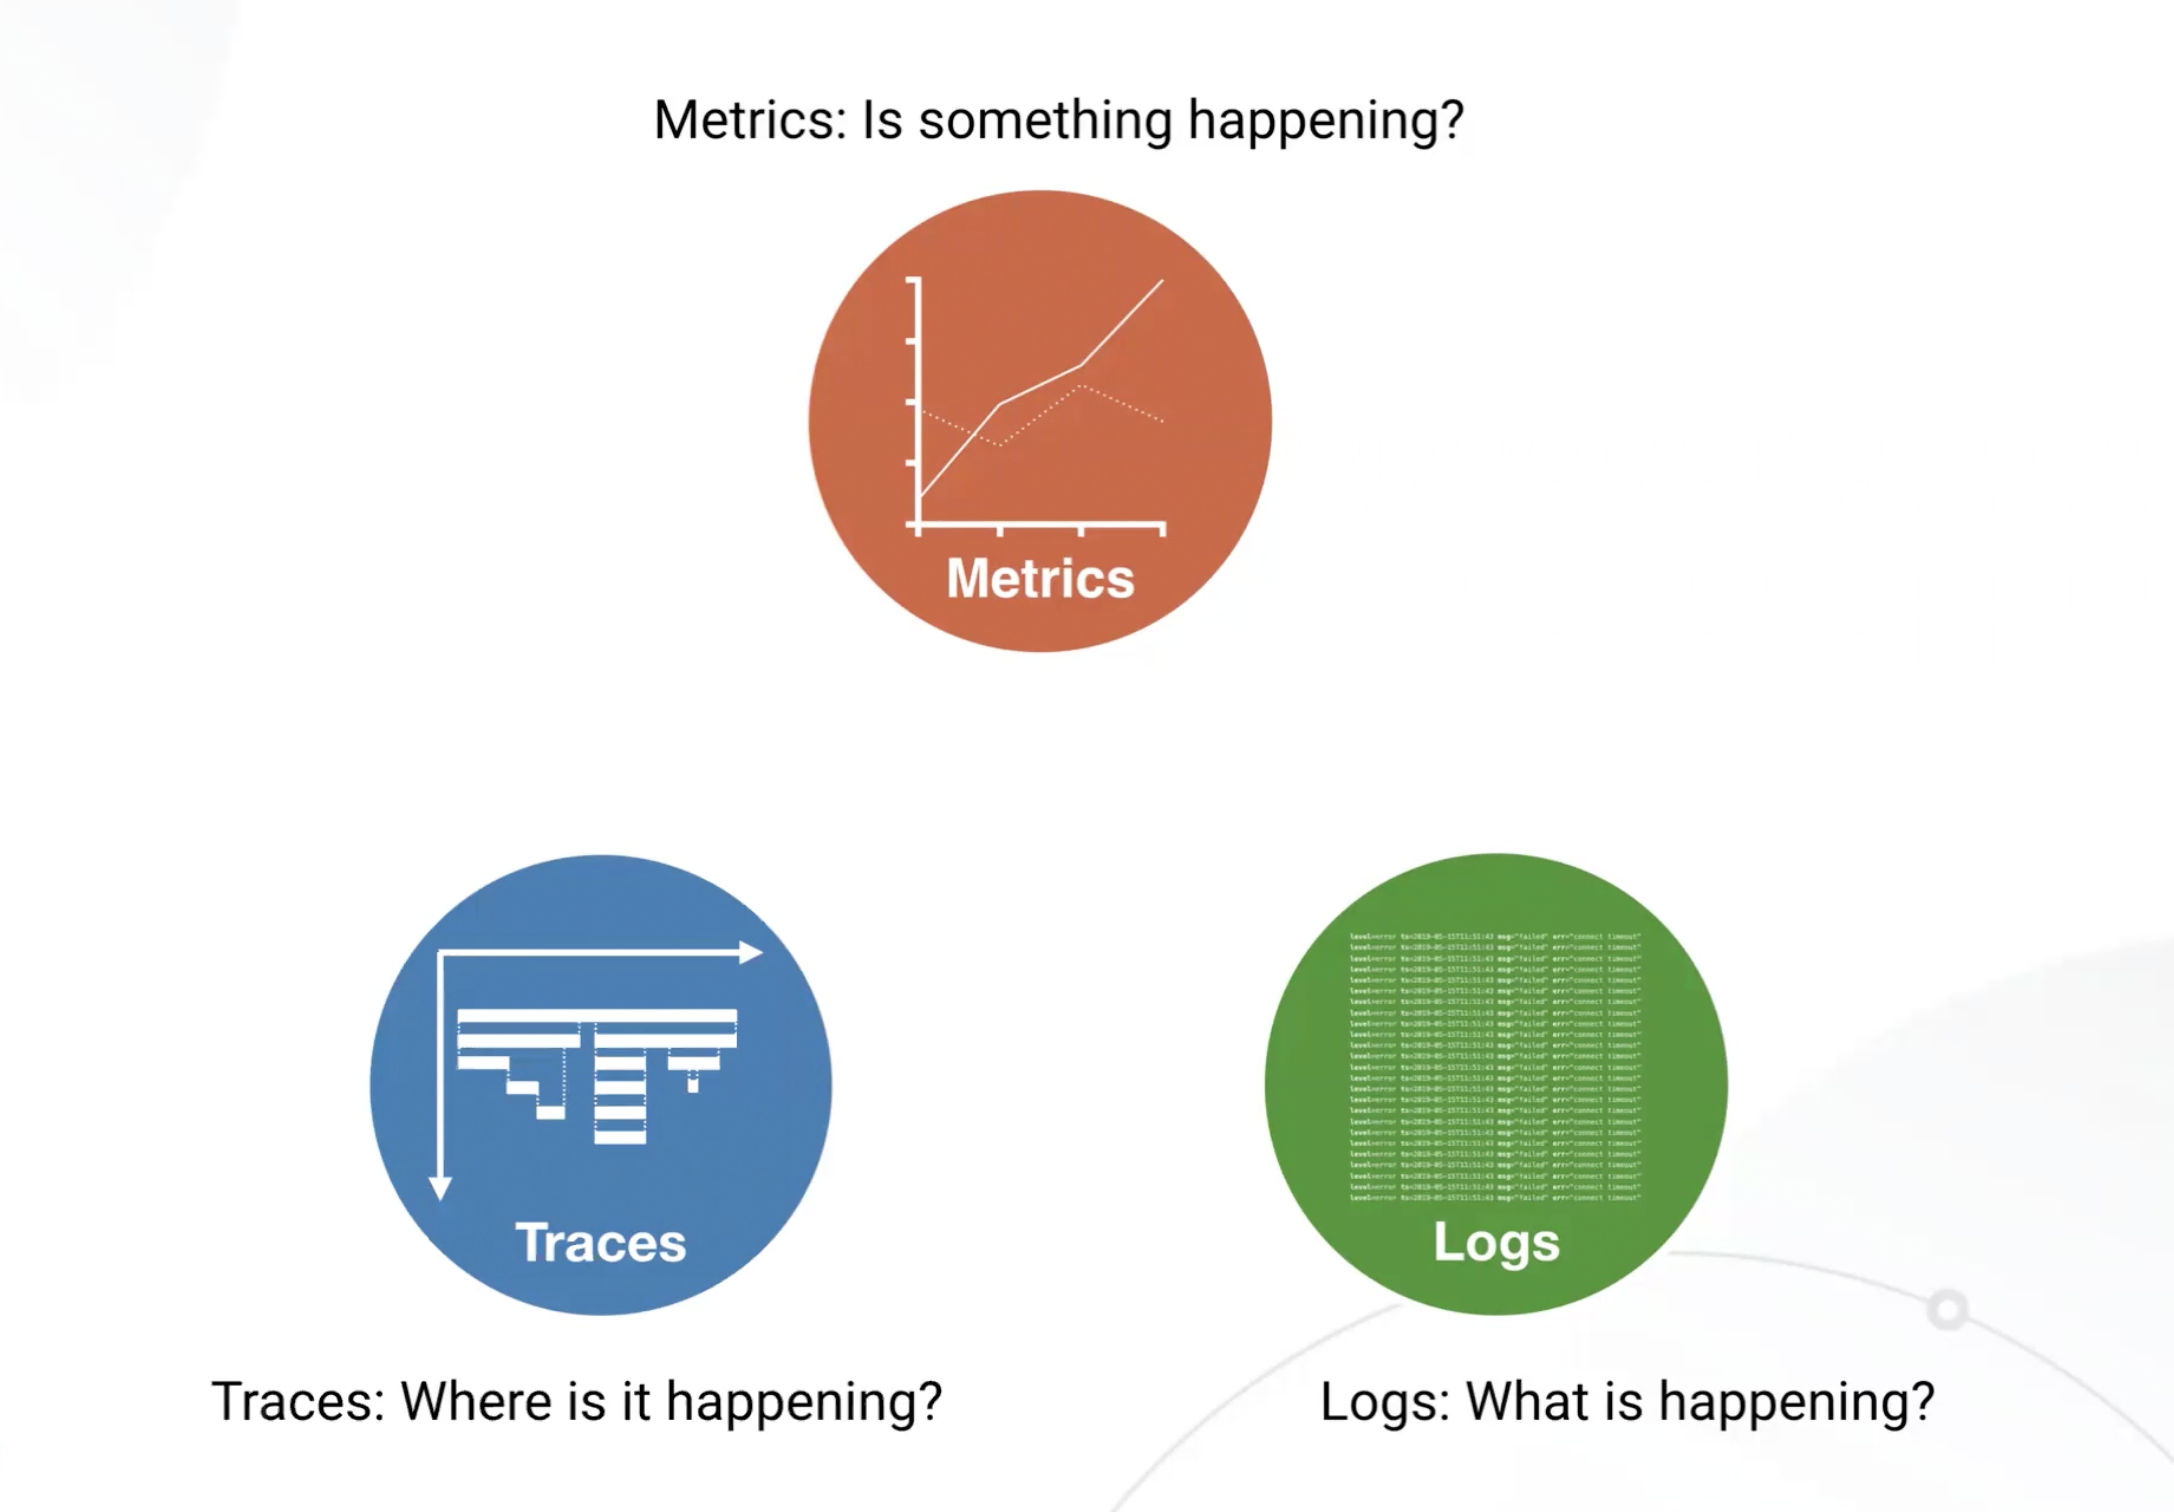
Trace data captures the path of requests in an application, as the requests travel through different components and services
span records the start and end times of an operation
trace id - unique id per trace, which is passed along with the request as it moves through different services
Logs capture time-stamped record of events that occur within an application or service
- logs can serve as audit trails for tracking user actions, which provide information on what happened before, during and after an event within individual systems
// example of a log with traceId
{
  "timestamp": "2025-03-04T12:00:00Z",
  "level": "error",
  "message": "Login failed due to invalid credentials",
  "userId": "9876",
  "traceId": "abc123def456"
}
Metrics are numerical data points that capture specific performance characteristics of a system such as latency, throughput, error rates, CPI usage and memory consumption
Alerting systems analyze traces, logs and metrics to detect anomalies or failures
LGTM Stack
The LGTM stack consists of
Loki - log database
Grafana - data visualization
Tempo - traces
Mimir- metrics backend component
- Prometheuse - metrics